Data Analysis
Data in the oil and gas industry comes from many distributed sources in a variety of formats. Information is often scattered over ASCII and Excel files, Access and SQL databases, and proprietary file formats that reside in different company departments. As a consequence, proper analysis of data that has been collected through hard work and costing lots of money is not possible or extremely painstaking.
We bring order into your data and develop tools for you so that you get access to your data and can put it to work. Routine analysis will take minutes where it used to take days or not be feasible at all.
Our Approach
- Work directly with the data. No more manual 'massaging' of data in Excel. If you need to manipulate data then update the actual data, not a copy. We write tools for you that assemble your data from the different sources.
- Analysis of geology by geologists. We speak your language, we know what kind of plots you expect.
- Graphical user interfaces. We develop graphical user interfaces that reflect and simplify your workflow. With a few clicks you convert your data into graphs that you can present at meetings and build your decision on.
Tools
Our main tool is Python with its rich ecosystem of data and visualization libraries. It covers everything from data cleaning and automation to interactive dashboards, statistical analysis, and machine learning, and it is easy to maintain when your data structure changes or you want to extend the analysis. If necessary, we put C++, Matlab, custom SQL, and VTK to work, but we will spare you the technical details.
Examples
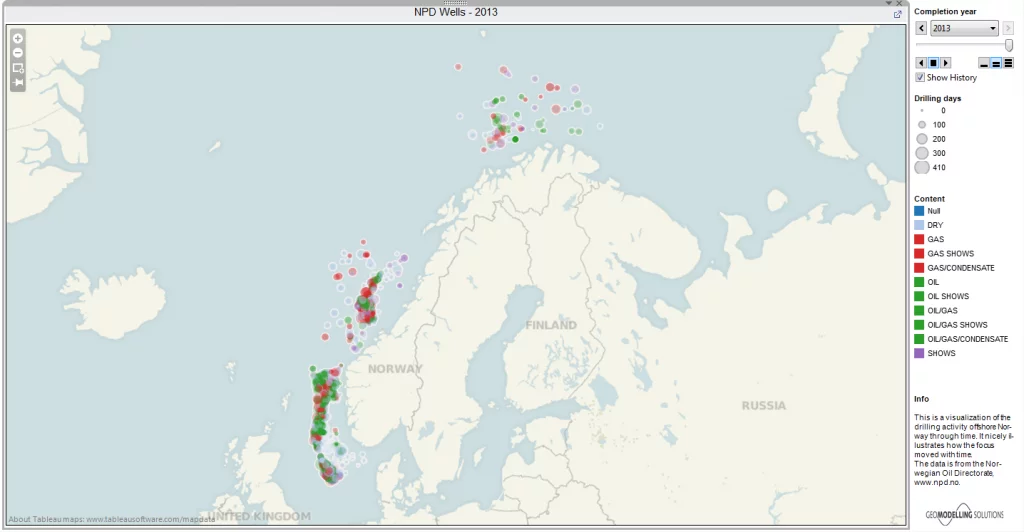
This is a visualization of the drilling activity offshore Norway through time. It nicely illustrates how the focus moved with time.
The data is from the Norwegian Offshore Directorate, www.sodir.no.
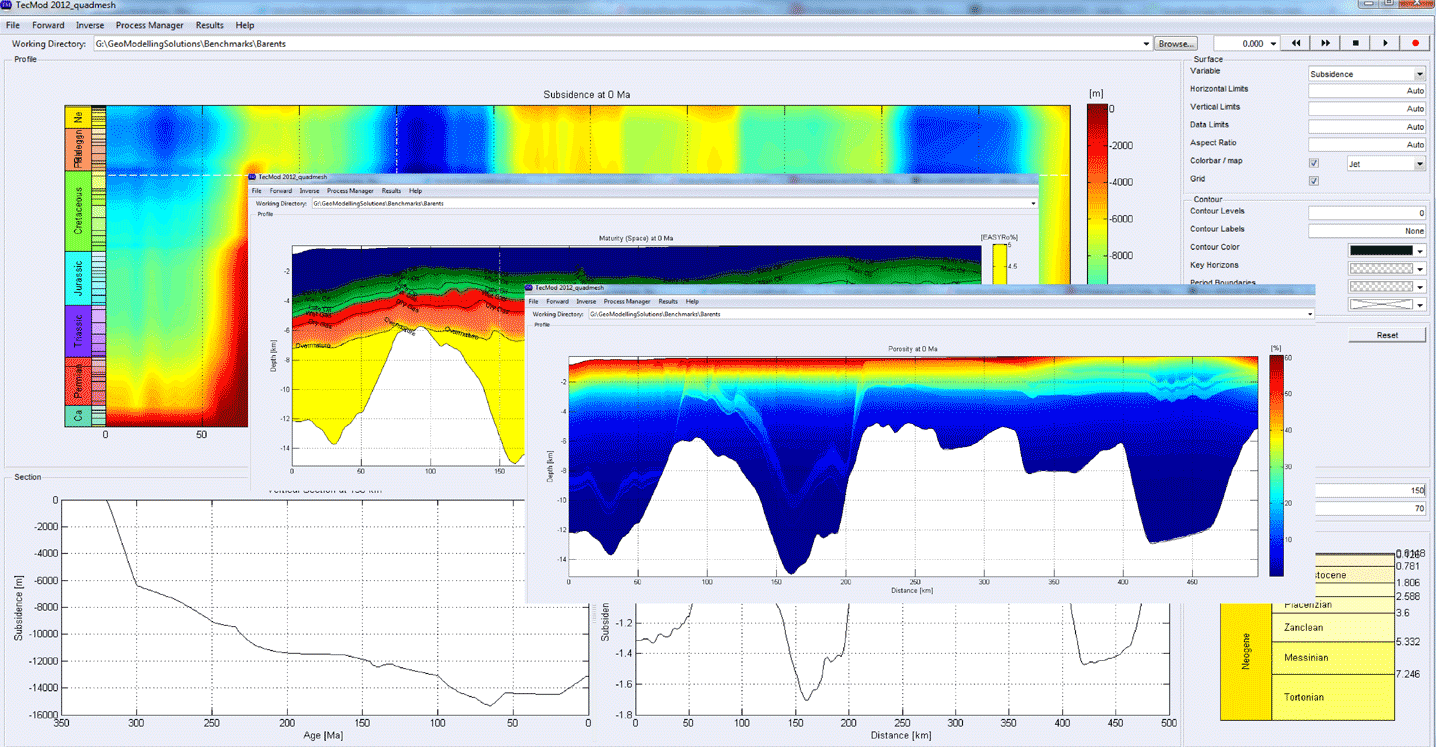
The TecMod GUI is an example of a data analysis tool that builds up on Matlab.